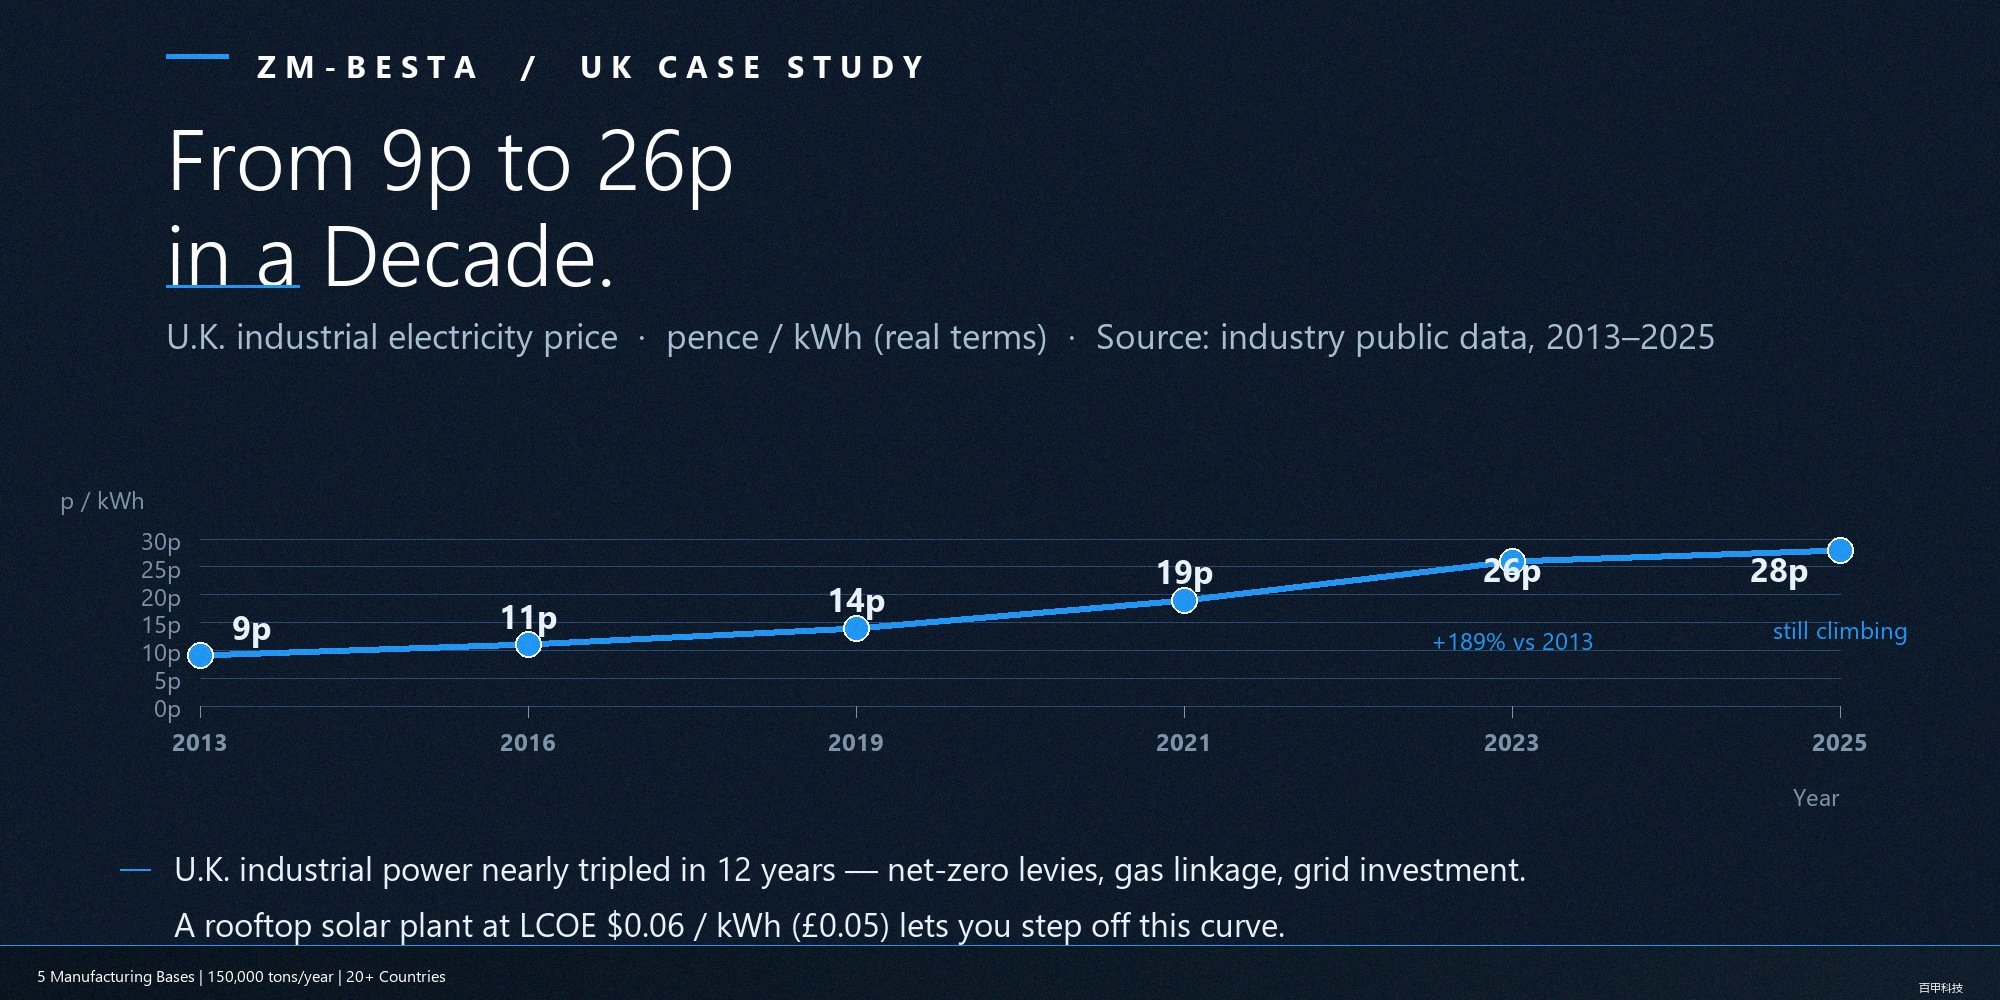
Start with one curve: the UK industrial electricity price was around 9 pence per kWh in 2013 and 26 pence in 2023. In ten years, it nearly tripled.
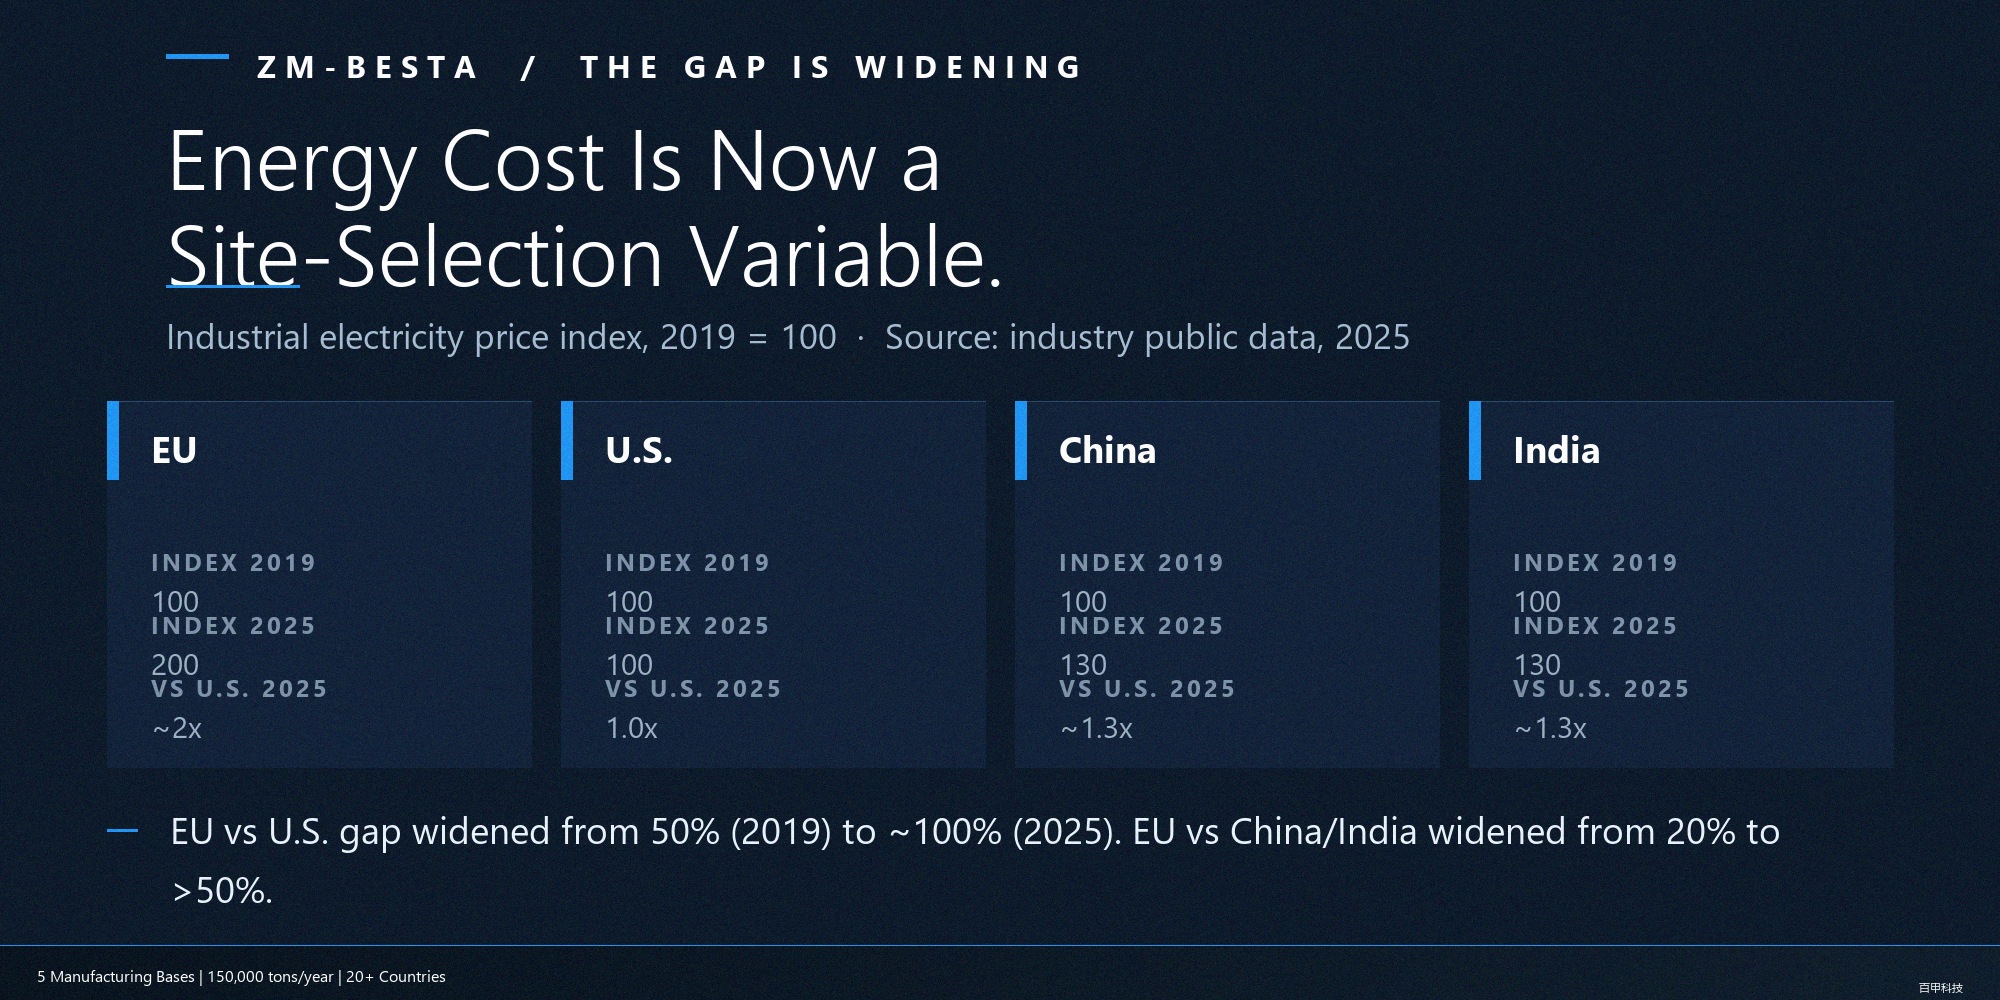
Now a comparison: in 2025, electricity prices for energy-intensive industries in the EU are about twice those of their US counterparts and more than 50% higher than in China and India. In 2019, those two gaps were only 50% and 20%.
High prices are not the whole story. An industrial electricity bill has two line items, and many plant owners only watch the first one. This article breaks both lines down to answer one question: how long is the payback period for a rooftop solar system, really?
Industrial Electricity Prices: A Decade-Long Upward Curve
Industrial Electricity Prices in Key Markets (2025, subject to market fluctuation)
| Market | Industrial Electricity Price (USD/kWh) | 10-Year Trend |
| Germany | $0.27-0.38 | Steady rise |
| UK | $0.27-0.37 | Nearly tripled in 10 years |
| US | $0.12-0.15 | Moderate rise |
| India | $0.085-0.12 | Rising with fluctuations |
The Gap Is Widening
The EU–US electricity price gap has widened from 50% in 2019 to roughly 100% in 2025. Energy cost has become a hard variable in where manufacturing is located and whether it survives.
The Second Line on Your Electricity Bill: The Demand Charge
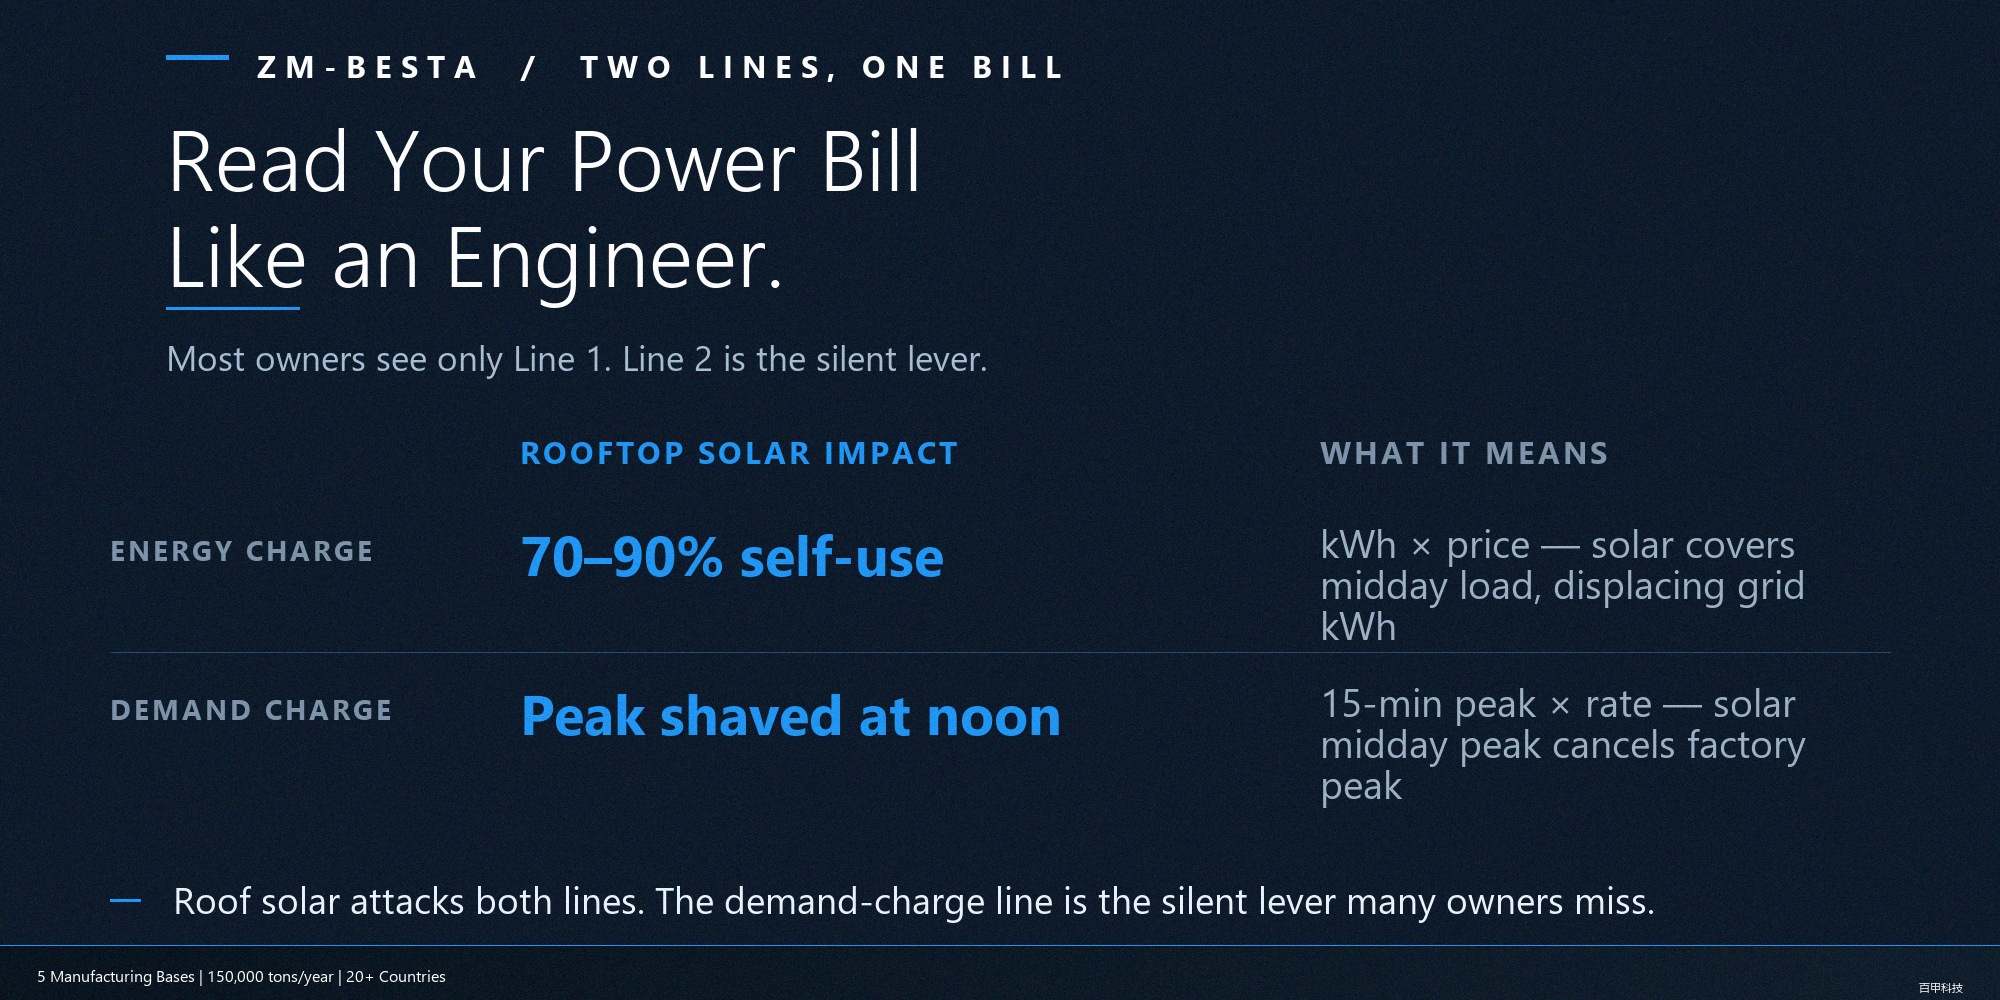
How the Two Lines Work
| Charge Item | Basis | Feature |
| Energy Charge | Billed by energy consumed | Price increases show up directly here |
| Demand Charge | Billed by peak instantaneous power | A single spike sets the basis for the whole month |
The demand charge is the “penalty line” on the bill: a single 15-minute power spike sets the demand basis for the entire month. The harder you draw power, the more expensive this line gets.
Rooftop Solar Cuts Both Lines at Once
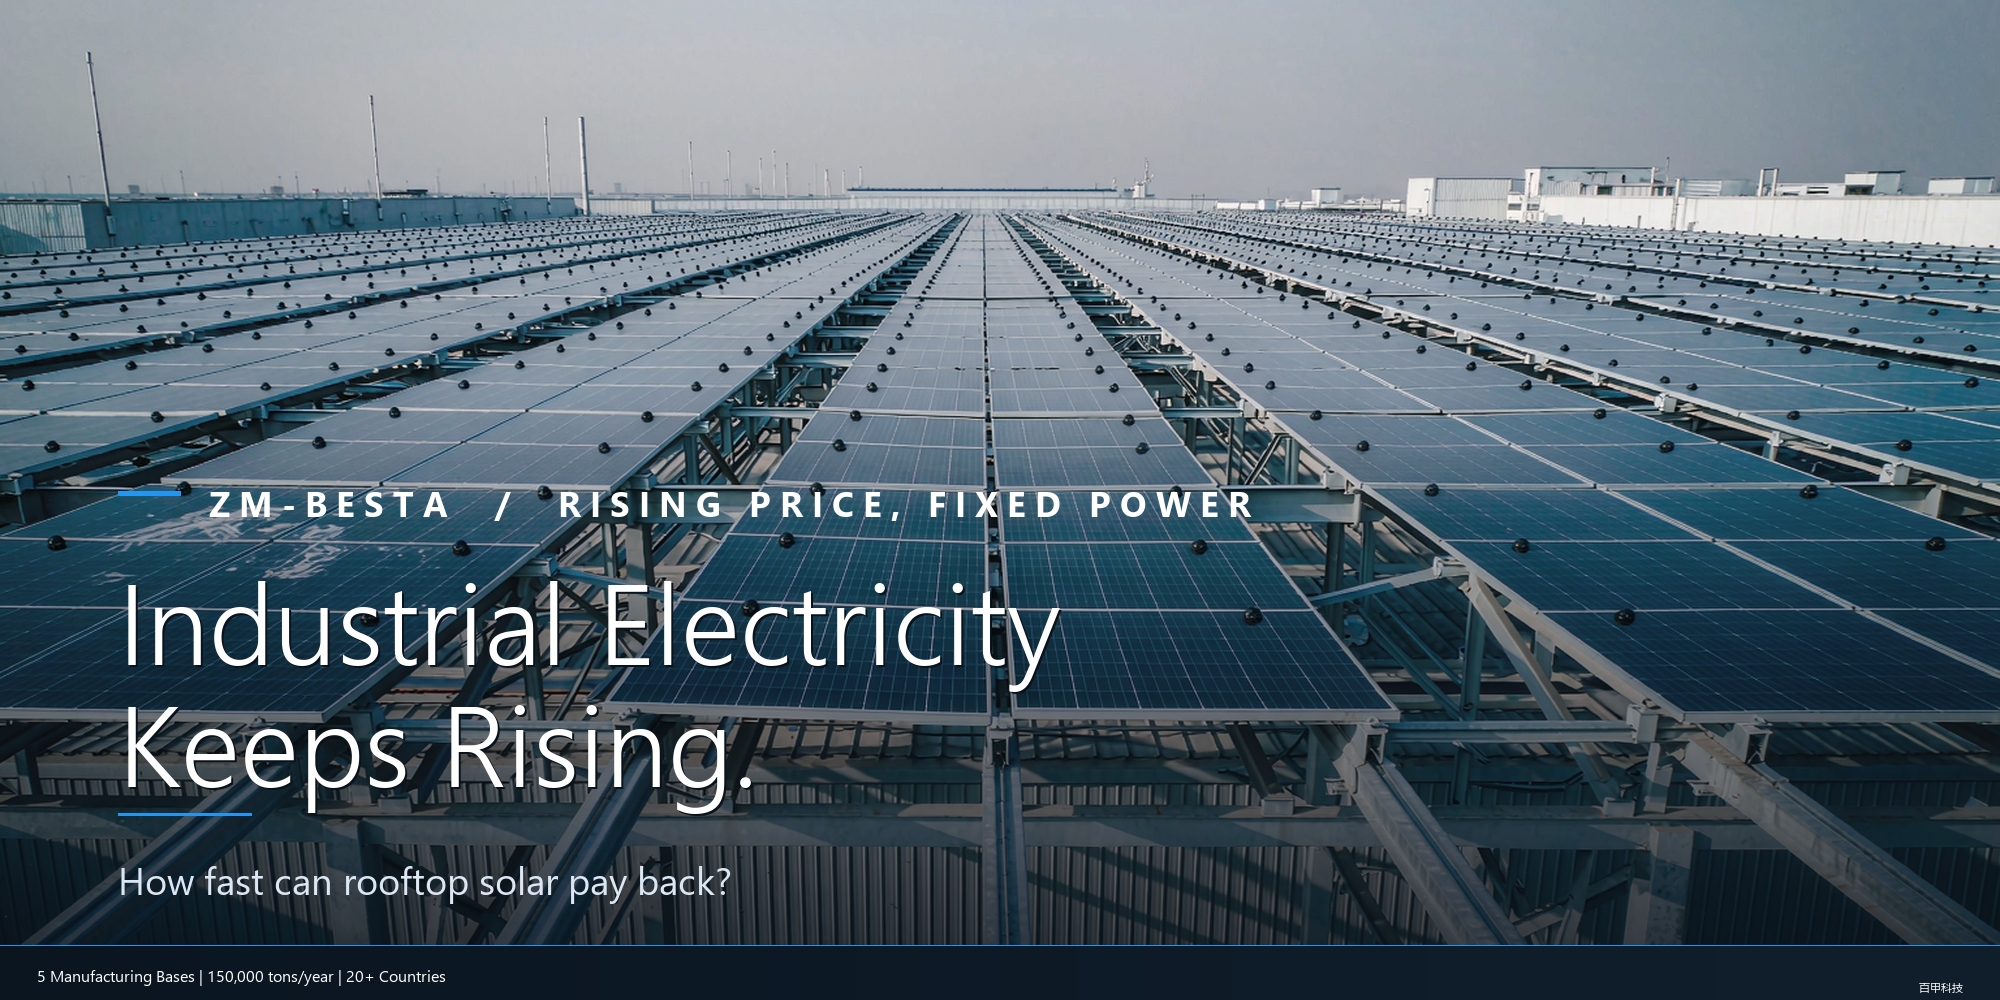
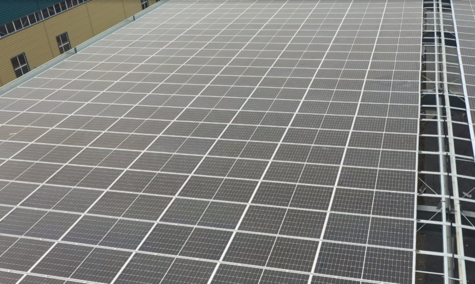
Line one: the energy charge. Based on 2025 market conditions, C&I distributed solar has a per-kWh cost of roughly $0.04–0.08/kWh; the gap against each market’s industrial electricity price is pure saving. Self-consumption ratios on industrial rooftops are typically 70–90%, and plants that run during the day absorb almost all of the output.
Line two: the demand charge. Solar output peaks at midday, which is exactly when most plants hit their load peaks. Shave the peak, and the demand basis drops. It is a pleasant surprise many owners only discover after installing.
Solar ROI: A Payback Calculation Framework
Key Parameters
| Parameter | Typical Value |
| Per-kWh cost of C&I solar | $0.04-0.08/kWh |
| Self-consumption ratio | 70-90% |
| System lifespan | 25 years |
| Payback period (daytime load dominated) | 2–5 years |
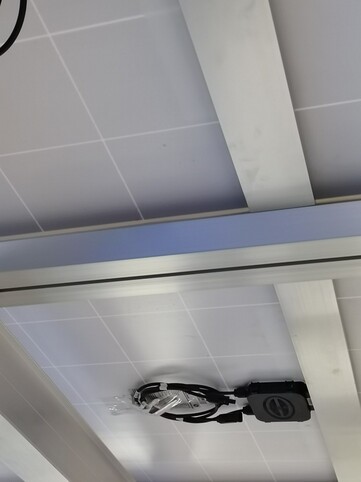
A Simple Calculation
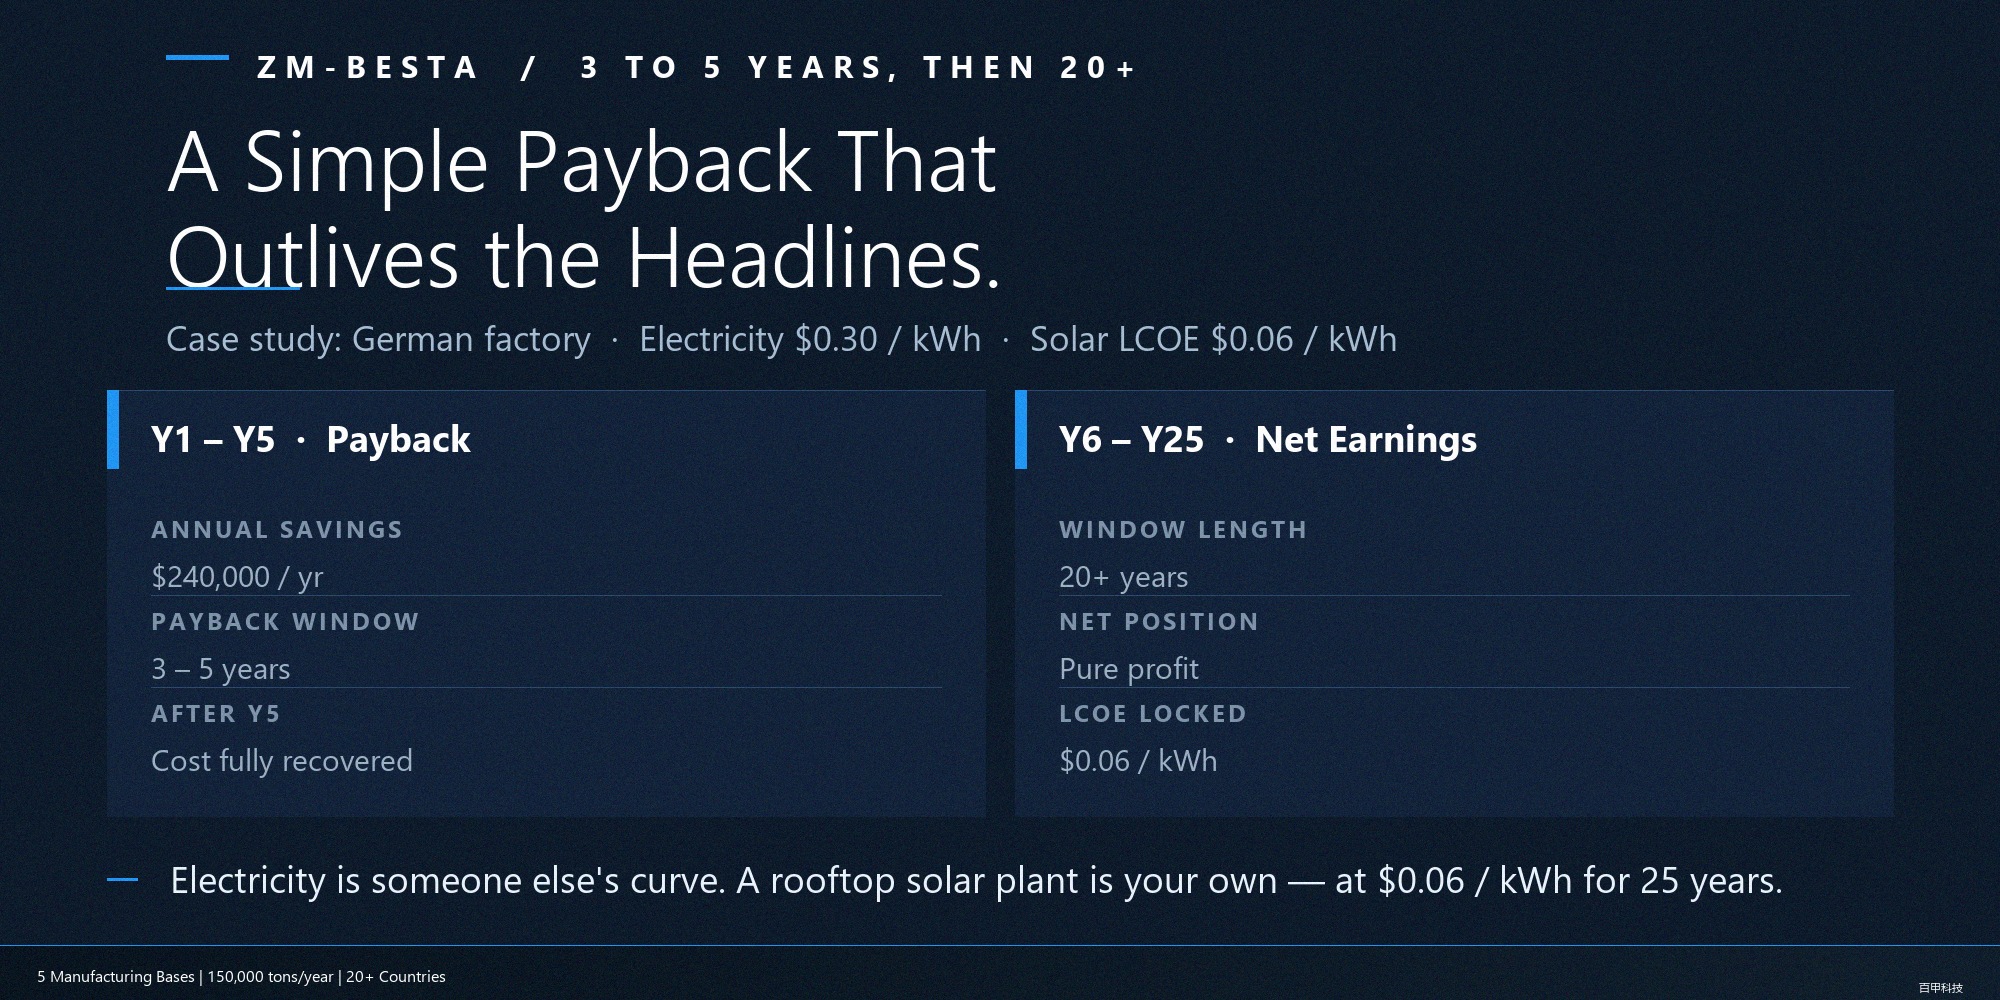
Take a German plant as an example: an industrial electricity price of $0.30/kWh and a solar per-kWh cost of $0.06/kWh means a net saving of $0.24 per kWh. With 1 million kWh of annual self-consumption, the saving is about $240,000 a year. Based on current market pricing for system investment, the payback period typically falls in the 3–5-year range, followed by more than 20 years of net gains.
In one sentence: the electricity price is someone else’s curve, but your roof is your own power plant. Prices rise for a decade; your per-kWh cost is locked in for 25 years.
Structure: The Foundation of Your Rooftop Power Plant
Rooftop solar starts with a roof that can carry the load. Distributed solar adds 15–25 kg per square meter of dead load. Retrofitting an existing plant requires a structural assessment first and can incur strengthening costs (15%–25% of the budget); a new plant that includes solar loads at the design stage pays zero for strengthening — that is the value of BIPV design.
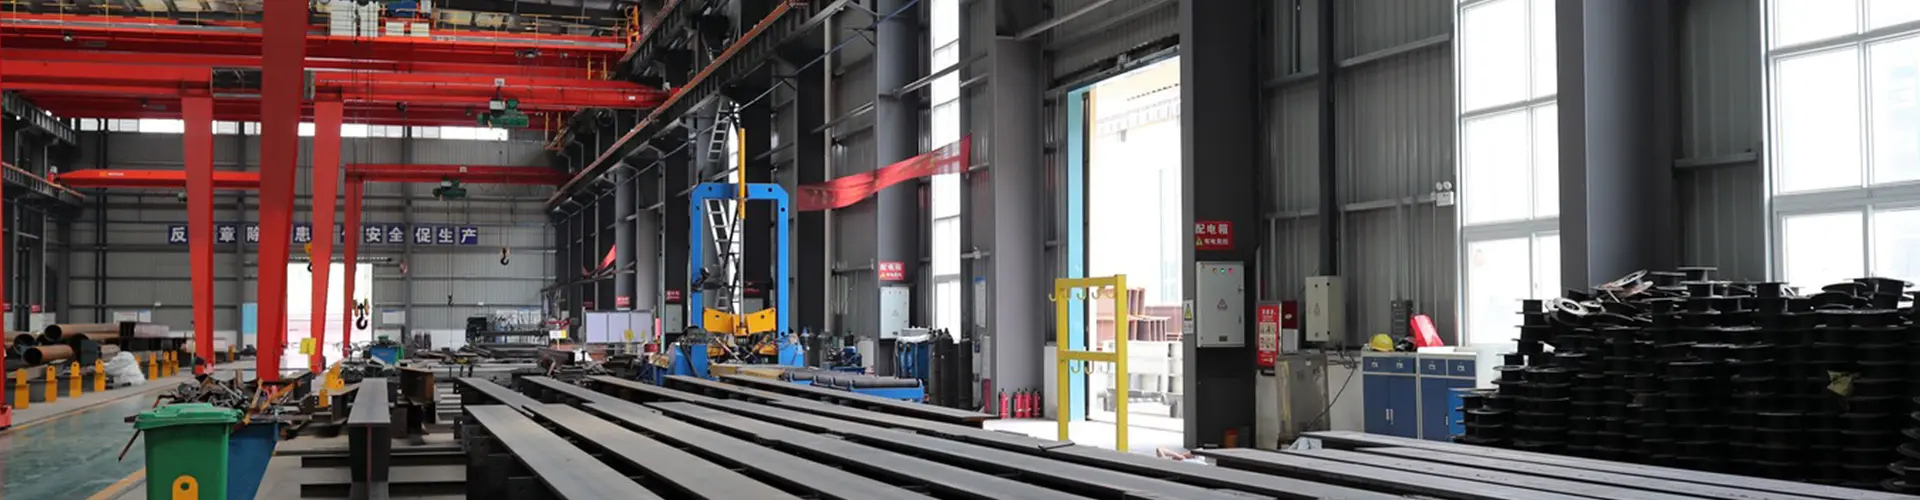
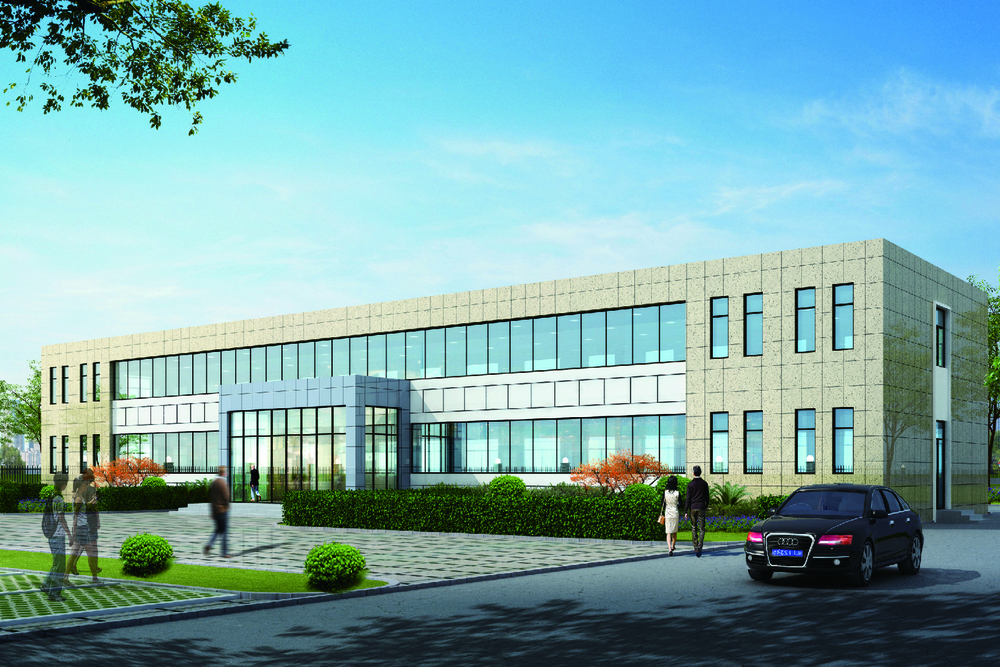
ZM-Besta: five production bases with 300,000 m² of factory buildings; Grade A steel structure design, Special Grade fabrication, and Grade I general construction contracting qualifications; a self-developed solar product line; EN 1090 (CE) certification; and ISO 9001/14001/45001 certification. Structure and solar drawings come from one company — a single accountable party from foundation to power generation.
FAQ
Q1: How long is the typical payback period for rooftop solar?
A: 2–5 years is common for industrial projects dominated by daytime loads, and faster in high-price markets such as Germany and the UK. Send us your electricity bill and roof parameters and we will produce an estimate.
Q2: Can the demand charge really be reduced?
A: Solar output at midday shaves the load peak, lowering the demand basis. But it does not work on cloudy days; it must be assessed against your load profile, and we cannot guarantee it in every market.
Q3: What if the self-consumption ratio cannot reach 70%?
A: Plants running continuously during the day usually consume nearly all the output. For single-shift or night-oriented workshops, add energy storage or size the system down to match the load.
Q4: How much will the modules degrade over 25 years?
A: Industry-standard warranty terms: roughly 2% degradation in the first year, then about 0.55% per year on average, retaining over 80% of rated power at the end of year 25.
Q5: What if an existing plant’s roof cannot take solar?
A: Start with a structural assessment. If strengthening is really needed, compare the cost against 25 years of benefits before deciding; for new projects, go straight to integrated design and pay zero for strengthening.
What is the industrial electricity price in your country? Send us your bill and roof parameters, and we will prepare a payback estimate:
Email: info@xzbesta.com